Kubernetes GPU Scheduling for LLM Inference: Queues, Fractional GPUs, and Cost
By Vatsal Shah | June 23, 2026 | 24 min read
Table of Contents
- Inference Workload Profiles: Batch vs. Real-Time LLM Serving
- GPU Scheduling Mechanics: Device Plugins, MIG, and Time-Slicing
- Cloud-Native LLM Serving Stacks: vLLM, TGI, and TensorRT-LLM on K8s
- Dynamic Autoscaling: Queue Depth, Metrics, and Scale-to-Zero Trade-offs
- Comparative Analysis: GKE vs. EKS vs. AKS GPU Architectures
- Step-by-Step: Deploying a Multi-Tenant Fractional GPU Cluster
- Pitfalls & Industrial Anti-Patterns in GPU Scheduling
- Futuristic Horizon: 2027-2030 Roadmap
- Key Takeaways
- Frequently Asked Questions
- About the Author
- Conclusion + CTA
- MIG (Multi-Instance GPU)
- An NVIDIA technology that partitions a physical GPU (e.g., A100 or H100) into up to seven separate hardware instances, each with dedicated memory, cache, and compute cores.
- Time-Slicing
- A software-based GPU sharing mechanism where multiple Kubernetes containers share a single GPU by executing sequentially via time-sliced scheduling loops.
- PagedAttention
- A memory management algorithm used in engines like vLLM to partition GPU memory into virtual pages, avoiding external fragmentation in KV caches.
- KEDA (Kubernetes Event-driven Autoscaling)
- A single-purpose event-driven autoscaler that scales Kubernetes workloads based on external event metrics (like Prometheus query queues).
- TTFT (Time to First Token)
- The latency between sending a prompt request and receiving the first generated token back from the inference engine.
Inference Workload Profiles: Batch vs. Real-Time LLM Serving
Deploying Large Language Models (LLMs) to production in 2026 presents a unique infrastructure challenge. Unlike traditional web services or simple machine learning classifiers, LLMs require massive, high-throughput accelerators (GPUs) to run inference. However, raw GPU compute is highly expensive, globally scarce, and easily wasted if workloads are poorly structured.
To build a cost-effective, high-performance architecture, platform engineers must segregate inference workloads into two distinct operational profiles:
1. Real-Time Transactional Inference
Real-time requests—such as conversational chatbot interfaces, interactive coding assistants, or live agent execution loops—have strict Service Level Agreements (SLAs). The critical metrics here are:
- Time to First Token (TTFT): Must remain below 150 milliseconds to keep interactions responsive.
- Inter-Token Latency (ITL): The time between generating subsequent tokens, which must outpace average human reading speeds (~30-50ms per token).
Because real-time requests are highly erratic, the underlying serving pods must remain warm, require low-latency networks, and need immediate access to dedicated GPU cores to avoid queue queuing lag.
2. Batch and Offline Inference
Batch workloads include tasks like offline evaluation runs, synthetic dataset generation, document processing, and background vector embedding updates. For these workloads, individual request latency is secondary to overall system throughput (tokens processed per second) and cost efficiency.
Batch workloads are highly tolerant of delays and queue times. They are perfect candidates for execution on preemptible (Spot) instances, where compute cost is reduced by up to 70% in exchange for the risk of sudden node teardowns.
Understanding this division allows platform architects to design mixed K8s clusters where high-priority real-time workloads run on reserved, dedicated instances, while backlogs of batch jobs scale dynamically into low-cost preemptible pools, filling the compute valleys.
GPU Scheduling Mechanics: Device Plugins, MIG, and Time-Slicing
By default, Kubernetes treats a physical GPU as an atomic, indivisible resource. A container can request 1 GPU or 2 GPUs, but it cannot request 0.25 of a GPU. This coarse scheduling model leads to massive waste. For example, running a lightweight model (such as a Llama-3-8B parameter model) for low-throughput internal tasks might only require 10% of an NVIDIA H100's compute power, yet it pins the entire card, locking out other workloads.
To solve this, modern Kubernetes clusters utilize three primary GPU sharing and scheduling models:
[Physical GPU (H100/A100)]
   │
   ├──► NVIDIA Multi-Instance GPU (MIG) ──► Isolated Hardware Partitioning (Dedicated VRAM & SMs)
   │
   ├──► Software Time-Slicing ──────────► Temporal Shared Execution (Common VRAM, Sequential Run)
   │
   └──► Multi-Process Service (MPS) ────► Spatial Shared Execution (Shared Memory, Parallel Run)
1. NVIDIA K8s Device Plugin
The official NVIDIA Device Plugin exposes GPUs to Kubernetes. It monitors GPU health, registers GPU resources with the kubelet, and allows containers to request them using standard resource limits:
resources:
  limits:
    nvidia.com/gpu: 1
While simple, this baseline plugin does not natively split GPUs, requiring platform teams to layer additional sharing strategies.
2. Multi-Instance GPU (MIG)
Multi-Instance GPU (MIG) is a hardware-level partitioning technology available on newer NVIDIA architectures (Ampere and Hopper, such as A100 and H100). MIG physically divides a single GPU into up to seven independent GPU instances.
Each instance possesses its own dedicated streaming multiprocessors (SMs), high-bandwidth memory (HBM) controllers, and cache memory.
- Pros: Strong hardware isolation. A memory leak or compute spike in one container cannot impact another container sharing the same card.
- Cons: Partitions are static. Reconfiguring MIG profiles requires restarting node configurations or utilizing specialized orchestrators, and VRAM divisions are locked (e.g., an 80GB H100 split into seven ~10GB profiles).
3. Software Time-Slicing
Time-slicing is a software-based partitioning model where the NVIDIA driver oversubscribes the GPU. Kubernetes scheduler exposes multiple "virtual" GPUs on a single physical card. Containers run their workloads sequentially, switching context rapidly.
- Pros: Highly flexible, simple to configure, and compatible with older GPU architectures (e.g., T4 or V100).
- Cons: No memory isolation. If one container runs out of GPU memory (OOM), it can crash the physical GPU, impacting all other containers. "Noisy neighbor" performance spikes are common.
4. Multi-Process Service (MPS)
NVIDIA MPS is a software layer that allows multiple CUDA processes to run concurrently on the same GPU by utilizing spatial partitioning. Instead of running sequentially (like time-slicing), MPS allows processes to run in parallel, sharing GPU memory and compute resources dynamically.
For production LLM inference, MIG is the gold standard for high-availability multi-tenancy due to its strict hardware guarantees, while MPS is ideal for high-throughput batch workloads where soft isolation is acceptable.
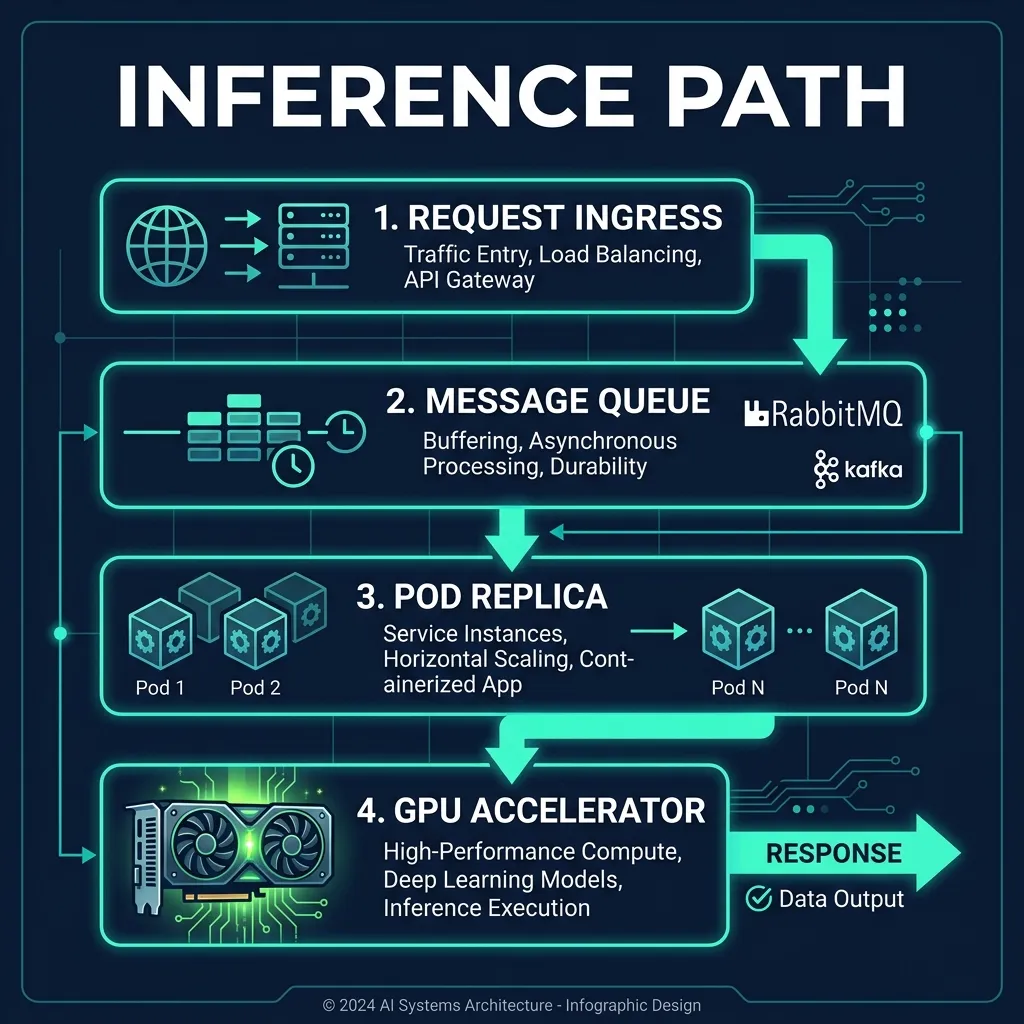
The following blueprint illustrates how incoming client requests route through Kubernetes ingress and scheduling queues to land on partitioned fractional GPU instances on the assembly floor:
Cloud-Native LLM Serving Stacks: vLLM, TGI, and TensorRT-LLM on K8s
Selecting the correct serving stack is as critical as configuring the underlying hardware. In 2026, three engines dominate the enterprise LLM landscape:
vLLM
vLLM is a highly popular, high-performance open-source serving engine. Its core innovation is PagedAttention, which optimizes KV cache management. In standard transformers, the KV cache (which stores context history during generation) is allocated in contiguous blocks. This leads to massive fragmentation, wasting up to 60-80% of available GPU memory.
PagedAttention works similarly to virtual memory paging in operating systems, dividing the KV cache into small, non-contiguous physical pages. This allows vLLM to utilize nearly 100% of available VRAM, facilitating high-batch-size concurrent generation.
Text Generation Inference (TGI)
Developed by Hugging Face, TGI is a production-grade toolkit for deploying LLMs. It features token streaming, continuous batching (which aggregates incoming requests into active execution loops dynamically), and flash-attention compilation for fast throughput.
TensorRT-LLM
NVIDIA's proprietary framework, TensorRT-LLM, compiles model weights into optimized TensorRT engines. It delivers the absolute highest throughput and lowest latency, particularly on modern Hopper architectures. However, it requires a complex compilation step for every model configuration change, making it less flexible than vLLM.
Below is a configuration file showing how to deploy vLLM on a Kubernetes cluster, utilizing the NVIDIA device plugin to assign a specific MIG profile (nvidia.com/mig-2g.20gb representing a partitioned 20GB H100 slice) to run Llama-3-8B:
apiVersion: apps/v1
kind: Deployment
metadata:
  name: vllm-llama3-8b
  namespace: llm-serving
spec:
  replicas: 2
  selector:
    matchLabels:
      app: vllm-llama3-8b
  template:
    metadata:
      labels:
        app: vllm-llama3-8b
    spec:
      containers:
      - name: vllm-container
        image: vllm/vllm-openai:latest
        args:
        - "--model"
        - "meta-llama/Meta-Llama-3-8B-Instruct"
        - "--port"
        - "8000"
        - "--gpu-memory-utilization"
        - "0.90"
        - "--max-model-len"
        - "4096"
        resources:
          limits:
            nvidia.com/mig-2g.20gb: "1"
          requests:
            nvidia.com/mig-2g.20gb: "1"
        ports:
        - containerPort: 8000
        readinessProbe:
          httpGet:
            path: /health
            port: 8000
          initialDelaySeconds: 60
          periodSeconds: 10
Dynamic Autoscaling: Queue Depth, Metrics, and Scale-to-Zero Trade-offs
Standard Kubernetes Horizontal Pod Autoscaler (HPA) works by tracking CPU and GPU resource utilization:
$$\text{Target Replicas} = \lceil \text{Current Replicas} \times \frac{\text{Current Metric Value}}{\text{Target Metric Value}} \rceil$$
However, this formula fails completely for LLMs.
Modern LLM serving engines pre-allocate almost all available GPU VRAM upon startup. For example, if you set --gpu-memory-utilization 0.90, vLLM will immediately seize 90% of the GPU's memory to allocate the PagedAttention KV cache pool. To Kubernetes HPA, the pod looks permanently saturated (90% utilization), even if it is idle and processing zero queries. This results in the cluster immediately scaling to its maximum replica count and sitting there, wasting thousands of dollars of idle compute.
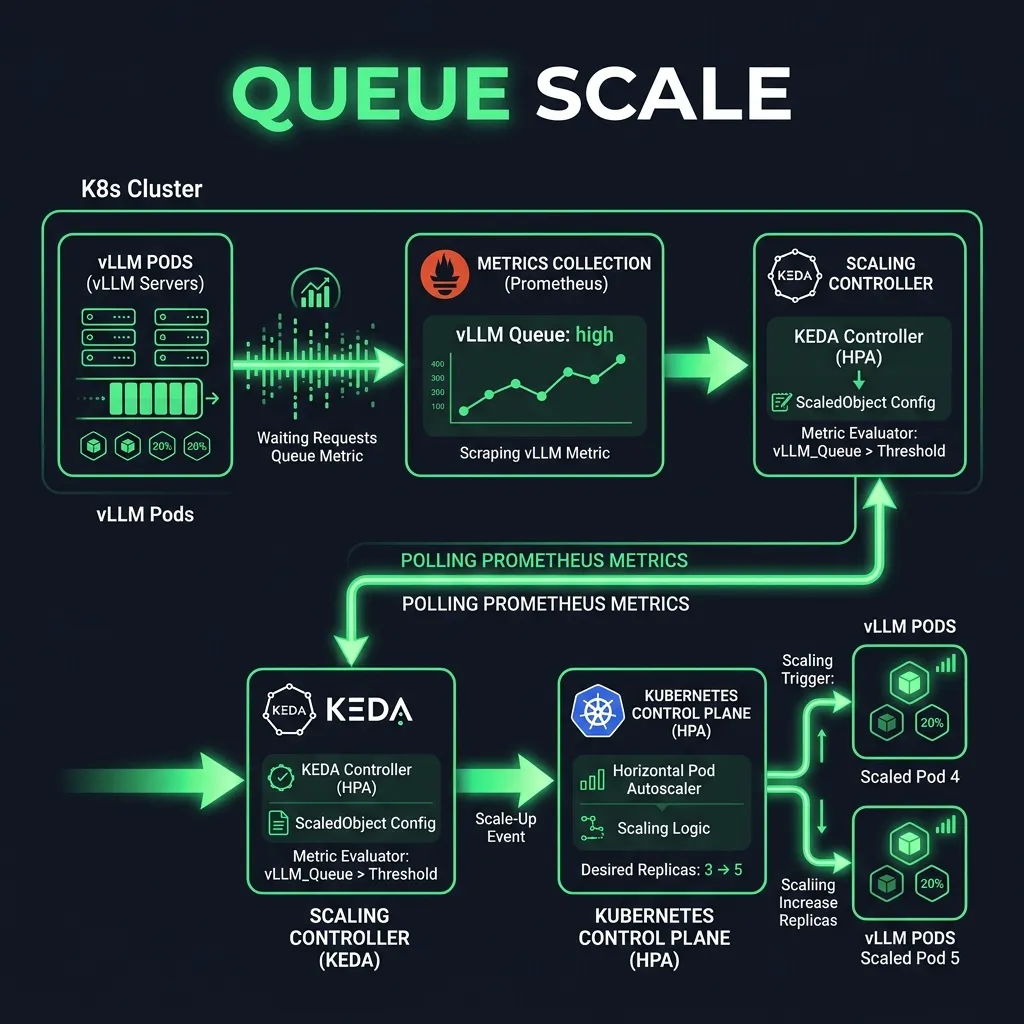
The Solution: Scaling on Queue Metrics using KEDA
To scale LLM pods correctly, you must track application-level metrics—specifically pending queue depth (the number of queries waiting in the engine queue because the GPU is full) or prompt latency.
This is implemented using KEDA (Kubernetes Event-driven Autoscaling) and Prometheus:
- Exporter: The vLLM pod exposes Prometheus metrics (such as
vllm:num_requests_waiting). - Scraper: Prometheus collects this metrics feed at high frequency.
- KEDA Scaler: KEDA reads the metric from Prometheus and scales the deployment pods dynamically.CODE
[Prometheus Metrics] ──► [vllm:num_requests_waiting] ──► [KEDA Operator] ──► [Scale Pods Up/Down]
The Scale-to-Zero Trade-off
For enterprise platforms supporting internal tools used sporadically, scaling deployments to zero pods during inactive hours saves massive capital. However, LLM cold starts are brutal:
- Model Download: Model weights (e.g., Llama-3-70B is ~140GB) must be pulled from a registry or shared storage volume. Even over fast network interfaces, this takes minutes.
- Model Loading: The model weights must be loaded into GPU memory, and CUDA engines must initialize, adding another 30-90 seconds.
- Warmup Query: The first query incurs overhead as the KV cache partitions allocate.
A total cold start of 3 to 10 minutes makes scale-to-zero unusable for real-time customer APIs. To mitigate this:
- Set a minimum replica count of
1for high-priority user-facing namespaces. - Use local SSD node pools to cache model weights on the physical nodes.
- Use optimized container registries and fast networks (e.g., AWS EBS GP3 or GCP Local SSD with custom caching adapters).
Comparative Analysis: GKE vs. EKS vs. AKS GPU Architectures
Each major cloud hyperscaler offers a custom Kubernetes management service with unique GPU virtualization and scheduling capabilities. Platform teams must evaluate these ecosystems based on cost, tooling, and scheduling speed:
| Operational Dimension | Google Kubernetes Engine (GKE) | Elastic Kubernetes Service (EKS) | Azure Kubernetes Service (AKS) | Architectural Impact |
|---|---|---|---|---|
| Multi-Instance GPU (MIG) | Dynamic MIG profile provisioning via local daemonsets. | Static MIG layout configured at launch template level. | Semi-dynamic MIG provisioning via custom node pools. | GKE provides the lowest operational overhead for variable partitions. |
| Autoscaling Integration | Native Karpenter and GKE Cluster Autoscaler integration with GPU awareness. | Karpenter node templates optimized for fast GPU instance provisioning. | AKS Cluster Autoscaler with Azure Spot instance priority integrations. | EKS Karpenter delivers the fastest node boot times (~60s under load). |
| Model Cache Storage | GCSFuse secondary cache layer with local SSD mount points. | Amazon EFS or local EBS volumes optimized for fast streaming read IOPS. | Azure Files Premium or blob fuse mount points with high read throughput. | Crucial for reducing model load latencies and minimizing cold starts. |
| Instance Allocation Limits | Strong quota management bound to Google Cloud project limits. | Service quotas require manual enterprise ticket approvals. | Core count allocation caps require enterprise hybrid agreements. | Requires careful pre-planning to avoid scaling out-of-quota blockages. |
The comparative matrix highlights that while EKS leverages Karpenter for superior scaling speeds, GKE delivers a more native and dynamic GPU partitioning developer experience.
Step-by-Step: Deploying a Multi-Tenant Fractional GPU Cluster
Let's configure a multi-tenant Kubernetes cluster designed to run fractional GPU inference workloads safely. We will implement three configuration blocks:
- Namespace GPU Quota Limits: Ensuring one tenant namespace cannot monopolize the cluster's GPU budget.
- Priority Classes: Making sure critical production serving pods can preempt non-critical batch training pods.
- KEDA Scaling Rule: Autoscaling based on active vLLM pending requests.
1. Configure the Namespace Resource Quota
Apply this manifest to lock the development namespace to a maximum of 2 fractional GPU units, protecting the production namespace resource allocation:
apiVersion: v1
kind: ResourceQuota
metadata:
  name: gpu-quota-dev
  namespace: dev-inference
spec:
  hard:
    requests.nvidia.com/mig-1g.10gb: "2"
    limits.nvidia.com/mig-1g.10gb: "2"
2. Configure Production vs. Development Priority Classes
Create priority mappings to ensure production workloads always take precedence:
apiVersion: scheduling.k8s.io/v1
kind: PriorityClass
metadata:
  name: prod-llm-priority
value: 1000000
globalDefault: false
preemptionPolicy: Never
description: "Mission-critical production LLM serving endpoints. Do not preempt."
---
apiVersion: scheduling.k8s.io/v1
kind: PriorityClass
metadata:
  name: dev-batch-priority
value: 1000
globalDefault: false
preemptionPolicy: PreemptLowerPriority
description: "Non-critical development batch inference jobs. Can be preempted."
3. Configure the KEDA Prometheus Autoscaler
Deploy this ScaledObject to scale the vLLM deployment dynamically based on active waiting queries in the Prometheus metrics system:
apiVersion: keda.sh/v1alpha1
kind: ScaledObject
metadata:
  name: vllm-keda-autoscaler
  namespace: llm-serving
spec:
  scaleTargetRef:
    apiVersion: apps/v1
    kind: Deployment
    name: vllm-llama3-8b
  minReplicaCount: 1
  maxReplicaCount: 10
  cooldownPeriod: 300
  pollingInterval: 15
  triggers:
  - type: prometheus
    metadata:
      serverAddress: http://prometheus-k8s.monitoring.svc.cluster.local:9090
      metricName: vllm_num_requests_waiting
      query: sum(vllm_num_requests_waiting{deployment="vllm-llama3-8b"})
      threshold: '5'
Under this configuration:
- If the number of waiting requests across the deployment exceeds
5for over 15 seconds, KEDA will spawn additional vLLM pods. - If the queue drops back to zero, KEDA will scale the deployment down to the baseline replica of
1after a cooldown window of 5 minutes, preventing scaling loops.
This multi-tenant deployment architecture ensures that high-priority production queries receive immediate hardware compute, while development workloads run cost-effectively on partitioned hardware slices without risking stability.
Pitfalls & Industrial Anti-Patterns in GPU Scheduling
When designing LLM platform layers on Kubernetes, avoid these critical anti-patterns:
- Memory Pinning Miscalculations: Allocating a KV cache size that leaves no room for system processes. If
--gpu-memory-utilizationis set too high (e.g.0.98), the serving container will regularly crash with Out-of-Memory (OOM) errors during heavy system load phases. Always leave a 5-10% memory buffer for internal driver operations. - Context Window Over-Allocation: Allowing users to send prompt loads that exceed the model's physical context window. This forces the KV cache memory usage to spike dramatically, leading to batch dropouts. Enforce prompt length checks at the API gateway layer before forwarding requests to the inference nodes.
- Noisy Neighbor Software Sharing: Running high-priority customer APIs on time-sliced GPUs alongside batch processes. The temporal switching pattern will introduce massive latency spikes (up to 300% TTFT increases) when batch queries run. Enforce hard physical isolation (MIG) for all low-latency namespaces.
- Preemption Pipeline Failures: Running long-running agent loops on preemptible Spot nodes without an upstream retry mechanism. When a node is reclaimed by the cloud provider, the active execution context will crash. You must configure stateful checkpoints (such as stateful agent graphs) so that transactions can resume from the last saved state when rescheduled on a new node.
By setting clear boundaries, separating workloads, and leveraging KEDA queue-based scaling patterns, engineering teams can build resilient, high-density GPU serving grids that control cloud costs.
Futuristic Horizon: 2027-2030 Roadmap
The next wave of Kubernetes GPU orchestration will focus on shifting from raw virtual machines to dynamic, policy-driven compute fabrics:
2026: Static MIG partitions & queue-based KEDA scaling
   │
   ├──► 2027: Dynamic MPS orchestration and sub-millisecond hardware pooling
   │
   └──► 2028-2030: Multi-cloud serverless GPU meshes with latency-based auto-routing
Between 2026 and 2030, we will see the emergence of Multi-Cloud Serverless GPU Meshes. In this architecture, workloads are not scheduled on a specific node pool inside a single cloud provider. Instead, cognitive agents negotiate compute resources dynamically across global clouds, routing inference to the lowest-cost, highest-performance available node at the millisecond scale.
Platform teams that master queue-based scaling, fractional GPU isolation, and strict namespace policy control today will be positioned to leverage these hyper-scalable meshes as they go live.
Key Takeaways
- Avoid Resource Scaling: Never scale LLM workloads on standard memory or CPU metrics. Scale horizontally on queue depth and query latency.
- Isolate Production: Use strict NVIDIA MIG partitioning for customer-facing interfaces to prevent noisy-neighbor performance lag.
- Leverage Spot Nodes for Batch: Execute non-latency-sensitive batch processing on Spot nodes, protected by custom K8s PriorityClasses and preemptible-safe architectures.
- Prevent Cold Starts: Cache model files locally on nodes using local SSD pools to avoid dragging 100GB weights across networks during scale-up phases.
- Utilize KEDA: Implement KEDA triggers pointing directly to vLLM's internal metrics feed to align cluster capacity with real-time query demands.
Frequently Asked Questions
How does K8s ensure a container stays inside its MIG partition? +
Is it possible to combine MIG and time-slicing on the same GPU? +
How do Spot instance interruptions affect running inference queries? +
What is the performance overhead of using fractional GPUs? +
How does model compilation affect startup speeds? +
About the Author
Vatsal Shah is a technology executive, system architect, and sovereign founder specializing in enterprise AI adoption, digital business transformation, and stateful agentic system integration. Over his career, he has guided global engineering organizations, scaled enterprise software platforms, and designed high-throughput distributed systems that align business operations with emerging technology trends.
Conclusion + CTA
Managing GPU costs while maintaining low-latency APIs is the core bottleneck of the enterprise AI landscape. By implementing fractional GPU structures, configuring queue-based autoscaling, and segregating batch workloads onto Spot instances, platform teams can run stateful inference systems cost-effectively.
Are you looking to optimize your Kubernetes GPU configurations and build a scalable AI platform? Get in touch today to schedule a technical architecture session.
