STRATEGIC OVERVIEW
Practitioner breakdown of Value Stream Mapping for Software Teams: Eliminating Invisible Wait Time — written for CTOs, VP Engineering, and India GCC leads shipping production AI with measurable ROI.
Table of Contents
- The Invisible Constraint in Modern Software Delivery
- What is Value Stream Mapping (VSM)?
- Why Value Stream Mapping Matters in 2026
- Flow Time vs. Queue Time: The Core Metrics of Value Stream Analysis
- Step-by-Step Guide: Mapping Your Software Delivery Value Stream
- Real-World Use Case: How a 150-Engineer SaaS Team Trimmed Cycle Time by 74%
- Deep Analysis: Process-by-Process Wait Time and Handoff Comparison
- Eliminating Lead Time Waste: Practical Automation Strategies
- Pitfalls & Modern Anti-Patterns in Value Stream Mapping
- Futuristic Horizon: The 2027–2030 Value Stream Roadmap
- Key Takeaways
- Frequently Asked Questions (FAQ)
- About the Author
The Invisible Constraint in Modern Software Delivery
I have seen countless engineering leaders make the same mistake. They watch their developers write code, notice a delay in feature releases, and immediately conclude they need more headcount or faster coders. They run to implement AI coding assistants, hoping to compress coding timelines. Their dashboards quickly light up green: lines of code grow, commit frequencies spike, and story points completed per sprint surge.
Yet, the actual time it takes for a feature to reach production—the lead time—remains unchanged.
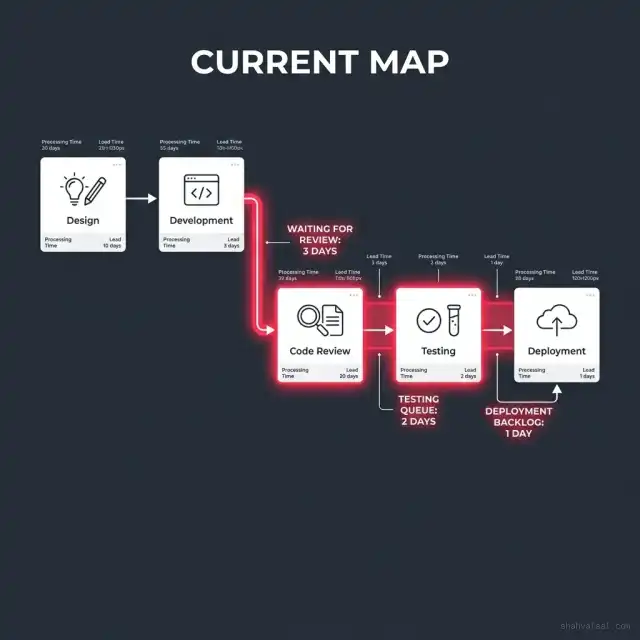
The reason is simple: your team's delivery problem isn't in the sprint. It's in the six days the pull request spends waiting for a code review. It's in the three days the code sits in staging awaiting QA validation. It's in the weekly release train coordination meetings. Value stream mapping exposes what your burndown chart hides.
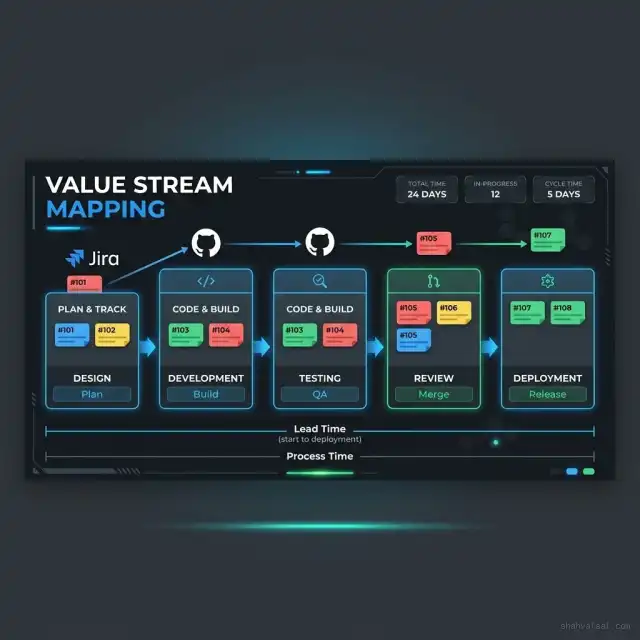
In traditional manufacturing, mapping the physical movement of parts is straightforward. You can see piles of inventory sitting on the factory floor, waiting to be processed. In software engineering, our inventory is invisible. It consists of lines of code sitting in a GitHub branch, tickets languishing in a Jira queue, or deployment packages waiting in a container registry.
Because this inventory is digital and silent, we fail to recognize it as waste. We measure resource utilization—how busy developers are—rather than flow efficiency. By shifting our focus from resource busy-ness to work item movement, we discover that optimizing software delivery is not about typing faster; it is about waiting less.
What is Value Stream Mapping (VSM)?
Value Stream Mapping (VSM) is defined as a visual, lean-management practice that documents every step in a process required to take a product or service from initial concept (or request) to final delivery. In software engineering, VSM maps the sequence of activities that transform a feature request or specification into live, value-producing code in production.
Historically derived from the Toyota Production System, VSM splits any sequence of actions into two fundamental categories:
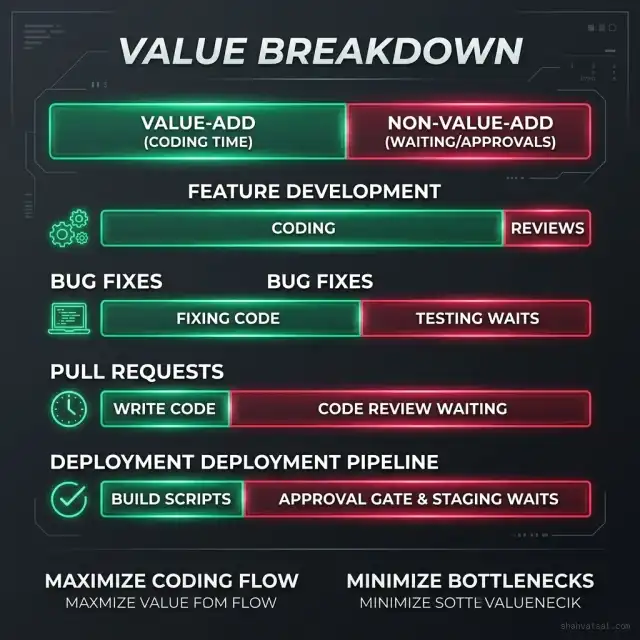
- Value-Add (VA) Activities: Active processing steps that directly contribute to the design, construction, or validation of the software (e.g., actively writing code, collaborating on design, refactoring architectures).
- Non-Value-Add (NVA) Activities / Waste: Wait states, queues, approvals, and context switches where the work item is static (e.g., ticket waiting in "To Do", PR awaiting reviewer approval, build pipeline queued, manual sign-offs).
By mapping the end-to-end value stream, teams create a shared visual record of how value flows through their organization. This visibility allows them to systematically target and eliminate waste rather than locally optimizing individual silos.
Why Value Stream Mapping Matters in 2026
The necessity of value stream analysis agile practices has hit a critical inflection point in 2026. The widespread adoption of AI code generation has dramatically altered the economics of software development. If a developer can write a feature implementation in sixty seconds using an agentic IDE, the active coding time has effectively shrunk to near zero.
Consequently, the downstream queues have become the absolute constraints.
Consider a typical scenario in a mid-sized engineering team:
- 2024 (Pre-AI): A feature took 5 days to write, 2 days to review, and 1 day to deploy. Total Lead Time = 8 days. Flow Efficiency = $5/8 \approx 62.5\%$.
- 2026 (AI-Assisted): The feature takes 4 hours to write (0.5 days). The code review still takes 2 days because the human reviewers are overwhelmed by the volume of code generated. The deployment still takes 1 day. Total Lead Time = 3.5 days. Flow Efficiency = $0.5/3.5 \approx 14.2\%$.
As active work time collapses under the weight of automation, the proportion of time a ticket spends waiting increases. Local optimizations (like making AI write code even faster) yield diminishing returns. If you reduce the coding time from 4 hours to 4 minutes, you save negligible time compared to the 48 hours the ticket spends waiting in the code review queue.
Furthermore, modern DevOps architectures have introduced new complexities. Platform engineering, distributed microservices, multi-model AI routing, and multi-cloud environments have increased the number of boundary handoffs. Without a structured digital VSM tool or visual map, organizations end up with fragmented visibility, leading to high friction, team friction, and eventual delivery stall.
Flow Time vs. Queue Time: The Core Metrics of Value Stream Analysis
To conduct a rigorous value stream analysis, teams must measure and contrast two primary metrics: Processing Time (PT) and Wait Time (WT).
- Processing Time (PT) (also known as Touch Time): The active duration during which a human or system is actively working on the ticket (e.g., writing the code, conducting the review, executing the tests).
- Wait Time (WT) (also known as Queue Time): The passive duration during which the ticket is idle, waiting for a transition, resource, or approval (e.g., waiting in the review queue, waiting for a build environment, waiting for marketing sign-off).
The total elapsed duration from request lock to production rollout is defined as Lead Time (LT):
$$\text{Lead Time (LT)} = \sum \text{Processing Time} + \sum \text{Wait Time}$$
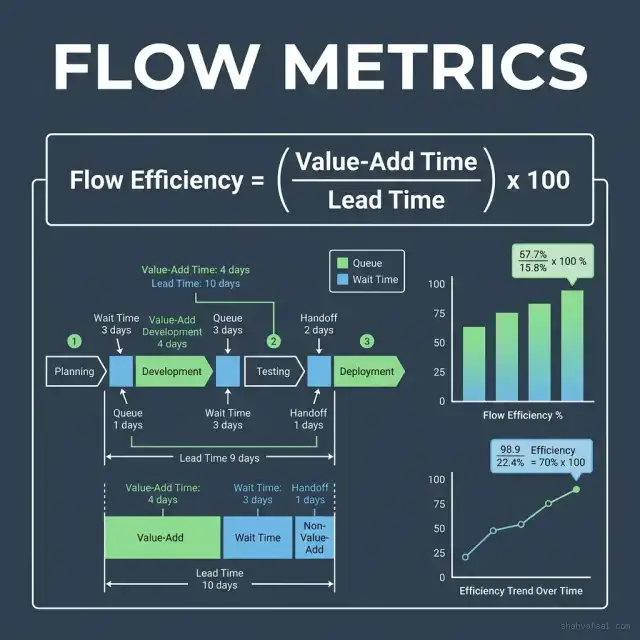
From these metrics, we derive the critical performance indicator: Flow Efficiency:
$$\text{Flow Efficiency (\%)} = \left( \frac{\sum \text{Processing Time}}{\text{Lead Time}} \right) \times 100$$
In my experience auditing engineering teams, the average flow efficiency of an enterprise software team sits below 15%. This means that for a feature that takes 30 days to deliver, a developer was actively working on it for only 4.5 days. The remaining 25.5 days were spent waiting in queues, inbox notifications, staging environments, and alignment meetings.
By tracking flow efficiency, teams shift from measuring resource utilization (e.g., "Is our QA engineer busy?") to measuring flow time (e.g., "How long is a ticket sitting in the QA queue?"). Optimizing the latter yields massive improvements in overall velocity without burning out resources.
Step-by-Step Guide: Mapping Your Software Delivery Value Stream
Creating an actionable value stream map requires a systematic, collaborative approach. Here is how to execute a VSM workshop with your engineering team.
Step 1: Align the Stakeholders and Define Boundaries
Do not attempt to map the entire corporate universe at once. Select a single, representative value stream. For example, map the process of delivering a standard user story from backlog grooming to production deployment. Ensure all roles in that loop—product manager, tech lead, developer, QA engineer, and release manager—are present in the room (or virtual whiteboard).
Step 2: Document the Process Steps (Current State)
Ask the team to write down every step the ticket physically goes through. Do not map the "ideal" path documented in corporate wikis; map what actually happens on Tuesday morning when a developer picks up a ticket.
Common steps include:
- Product manager drafts specification and lock state.
- Tech lead conducts architecture review.
- Developer implements code.
- Peer reviewer conducts code review.
- CI/CD pipeline builds and tests.
- QA team conducts verification.
- Release manager deploys to staging and production.
Step 3: Layer the Time Metrics
For each step, collect two numbers based on historical telemetry or team consensus:
- Active Processing Time (PT): How long does the actual work take if uninterrupted?
- Wait Time (WT): How long does the ticket sit in the queue before the step starts?
Calculate the total Lead Time and Flow Efficiency. Under normal circumstances, this exercise will immediately highlight massive wait times.
Step 4: Identify Waste and Bottlenecks (Mura, Muda, Muri)
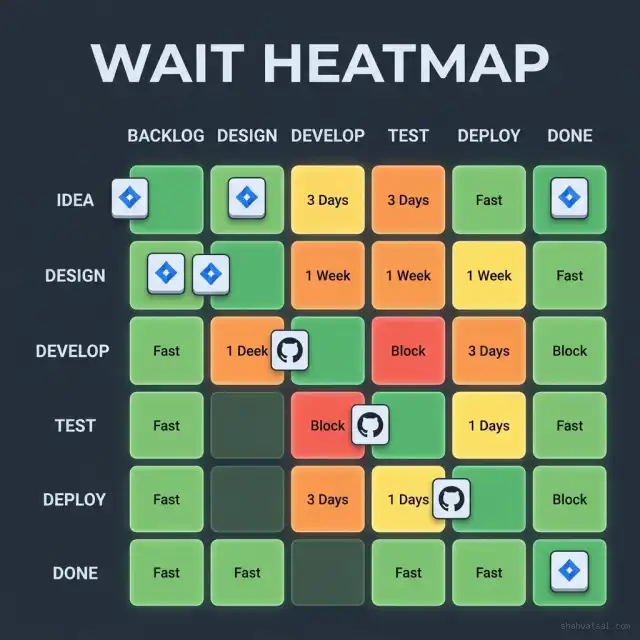
In Lean manufacturing, waste is categorized into Muda (wasteful activity), Mura (unevenness in workflow), and Muri (overburdening of resources).
- Software Muda: Context switching, manual regression tests, writing code for unverified features, redundant approvals.
- Software Mura: Dumping 20 pull requests on reviewers at 4:30 PM on Thursday, leading to massive queues.
- Software Muri: Expecting a single lead architect to review every pull request across 6 squads, creating a permanent bottleneck.
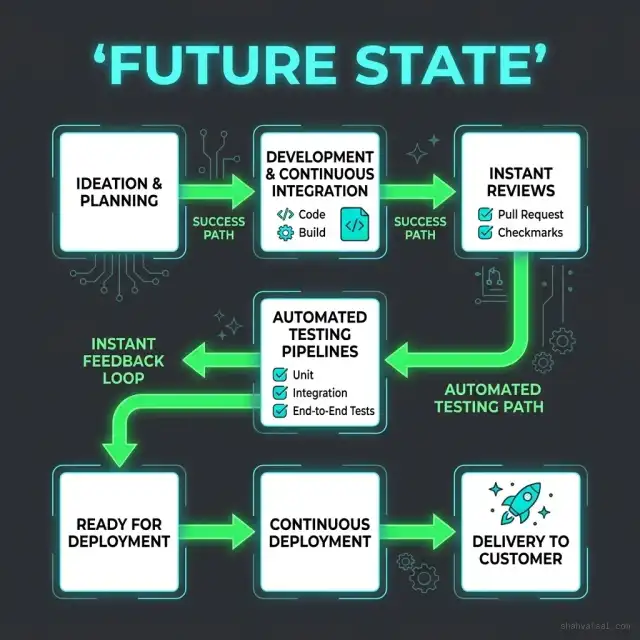
Step 5: Design the Future State Map
Define what the value stream should look like once waste is eliminated. Standard interventions include automating manual steps, replacing gatekeeping approvals with policy-based guardrails, and enforcing WIP (Work in Progress) limits to ensure even flow.
Real-World Use Case: How a 150-Engineer SaaS Team Trimmed Cycle Time by 74%
To understand the practical impact of lead time waste elimination, consider the transformation of a major B2B SaaS platform in early 2026. The engineering organization was struggling. Despite implementing AI coding assistants that increased code output by 40%, their time-to-market was declining. Product managers complained that simple features took weeks to ship.
I conducted a comprehensive value stream mapping audit. We analyzed 500 historical Jira tickets and matched them against GitHub pull request logs and CI/CD event payloads.
The audit revealed a staggering reality:
- Average Coding Time: 3.2 hours
- Average PR Wait Time (Queue): 92.4 hours
- Average QA Queue Wait: 48 hours
- Average Flow Efficiency: 4.1%
The team was spending 96% of its delivery lifecycle waiting. The core bottlenecks were the code review process (which required two senior approvals and had no prioritization queue) and staging environment queues (where QA testers had to wait for a shared server to become free).
The VSM Interventions
We implemented three targeted interventions based on the future-state design:
- Automated PR Routing: We integrated a code review routing engine. Small PRs (<50 lines) with high test coverage were auto-approved if they passed CI. Medium PRs were routed based on owner context, eliminating the "senior reviewer" requirement.
- Ephemeral Testing Environments: We replaced the shared staging servers with automated, preview environments spun up on-demand for every pull request.
- WIP Limits: Squads were prohibited from having more than 2 active tickets per developer in "In Progress" or "In Review". If a developer finished coding, they could not start a new ticket until they helped clear the review or QA queue.
The Results
Within one quarter, the impact was profound:
- Total Lead Time dropped from 12.4 days to 3.2 days (a 74% reduction).
- Flow Efficiency increased from 4.1% to 31.2%.
- Production defects decreased because developers were reviewing code in small, focused increments rather than massive, batch pull requests.
This team did not hire more developers, nor did they require people to work longer hours. They simply designed a system that stopped wasting their time.
Deep Analysis: Process-by-Process Wait Time and Handoff Comparison
The table below contrasts the current state (traditional agile) with the future state (optimized flow) across a standard software delivery value stream.
| Delivery Stage | Current Processing Time | Current Wait Time (Queue) | Future Processing Time | Future Wait Time (Queue) | Waste Elimination Driver |
|---|---|---|---|---|---|
| Spec Lock | 4.0 hours | 24.0 hours | 2.0 hours | 2.0 hours | Asynchronous collaboration & template standardization |
| Architecture Review | 2.0 hours | 48.0 hours | 1.0 hours | 4.0 hours | Policy-as-code validation & pre-approved patterns |
| Implementation | 8.0 hours | 12.0 hours | 2.0 hours | 1.0 hours | AI-assisted development with modular context matching |
| Code Review | 1.5 hours | 96.0 hours | 0.5 hours | 2.0 hours | Automated micro-PR approvals & review prioritization |
| Testing & QA | 3.0 hours | 48.0 hours | 0.5 hours | 1.0 hours | On-demand preview environments & automated regression |
| Deployment | 1.0 hours | 72.0 hours | 0.1 hours | 0.5 hours | Continuous deployment with automated canary gates |
| Total Path Summary | 19.5 hours | 300.0 hours | 6.1 hours | 10.5 hours | Flow Efficiency: 6.1% → 36.7% |
Eliminating Lead Time Waste: Practical Automation Strategies
To systematically eliminate lead time waste, organizations must move away from manual coordination and adopt policy-based automation. Here are the three most effective strategies for software value streams.
1. Implement WIP Limits at Handoff Boundaries
The most common cause of high wait time is work accumulation at process boundaries. When a developer finishes coding a ticket, their natural instinct is to drag it to "Ready for Review" and pick up a new ticket from the backlog. This local optimization increases individual throughput but destroys team velocity.
By enforcing strict WIP limits on the "In Review" and "Staging" columns, you force the team to swarming behavior. If the "In Review" queue is full, developers cannot pick up new work. They must review their peers' code or help QA resolve testing blockers. This ensures that work items move through the pipeline rather than piling up at the gates.
2. Auto-Approve Low-Risk Pull Requests
Code review queues are frequently the single largest source of delay. In traditional organizations, every pull request requires two human approvals, regardless of size or risk profile. A 5-line documentation fix sits in the same queue as a 500-line database schema change.
By integrating automated risk scoring, you can bifurcate the review stream:
- Low-Risk PRs: Changes under 50 lines with 100% test coverage and no architectural dependencies are auto-approved upon passing CI.
- High-Risk PRs: Changes modifying core APIs, database structures, or security modules are routed to senior reviewers with priority tags.
3. Deploy Ephemeral Preview Environments
Waiting for a shared staging environment to become free is a classic form of waste. When multiple developers are trying to verify their work on a single server, they end up blocking each other, resulting in merge conflicts and testing delays.
Modern cloud platforms allow you to spin up lightweight, isolated preview environments for every active pull request automatically. When the PR is opened, the CI pipeline builds the container, deploys it to a Kubernetes cluster, and posts a unique testing URL directly to the PR comments. When the PR is merged or closed, the environment is torn down, completely eliminating the staging bottleneck.
Pitfalls & Modern Anti-Patterns in Value Stream Mapping
While VSM is incredibly powerful, many software teams execute it poorly. Avoid these common anti-patterns:
1. Mapping the "Ideal" Instead of the "Real"
Many workshops fail because participants design the map based on how the process is supposed to work according to official guidelines or Scrum master slides. If you map the ideal process, you will miss the informal loops—like developers bypassing code review for "hotfixes" or tickets sitting in a hidden backlog. Always map the real, messy reality based on real commit logs and history.
2. Focusing on Resource Utilization
Traditional managers are obsessed with keeping people busy. They look at a developer sitting idle and immediately assign them a new task. Value stream mapping proves that busy people often create slow delivery systems. If every resource is utilized at 100%, the queue wait time approaches infinity. To achieve fast flow, you must build slack into the system.
3. Locally Optimizing Silos
A QA manager might purchase automated testing suites to compress testing time from 2 days to 2 hours. While this is a positive step, if the ticket still sits in the deployment queue for 2 weeks waiting for release approval, the overall customer lead time remains unchanged. Always focus on the system bottleneck—the global constraint—rather than locally optimizing individual stages.
Futuristic Horizon: The 2027–2030 Value Stream Roadmap
As we look toward the end of the decade, the practice of value stream mapping will undergo a dramatic shift, transitioning from static manual workshops to real-time, automated optimization systems.
Real-Time Value Stream Mining
By 2027, manual VSM whiteboarding sessions will be replaced by continuous value stream mining engines. These systems will sit as passive collectors across the entire engineering stack—ingesting telemetry from IDEs, task boards, source control systems, CI/CD runners, and production APM agents. They will construct live, dynamic value stream maps, highlighting queue build-ups and bottleneck shifts in real-time.
Autonomous Flow Remediation
By 2029, value stream management platforms will not just report bottlenecks; they will autonomously remediate them. If a queue starts building up at the code review stage, the system will dynamically adjust task routing—pausing incoming backlog tickets, shifting developer assignments, and spinning up AI review assistants to provide immediate, safe validation on standard changes.
The ultimate goal is the realization of the Zero-Wait Software Pipeline, where administrative delays are eliminated entirely, leaving human developers to focus exclusively on strategic intent, system architecture, and value creation.
Key Takeaways
- Wait time is the real killer: In traditional software organizations, up to 90% of a feature's lead time is spent waiting in queues rather than being actively coded.
- AI shifts the bottleneck downstream: As AI coding tools compress active implementation times to minutes, the downstream code review, testing, and deployment queues become the dominant constraints.
- Flow efficiency is the true compass: Stop measuring resource utilization. Measure flow efficiency—the ratio of active processing time to total lead time—to find out if your speed of code is translating to speed of value.
- Enforce WIP limits: Restricting the number of active tasks at process boundaries forces team collaboration, clears queues, and accelerates overall throughput.
- Transition to automated guardrails: Replace gatekeeping approvals and manual handoffs with automated policy checks, ephemeral preview environments, and risk-based pull request routing.
Frequently Asked Questions (FAQ)
What is Value Stream Mapping (VSM) in software engineering?
Value Stream Mapping in software engineering is a visual practice of documenting every process step required to design, implement, test, and release a software feature. It highlights the distinction between active processing time and passive waiting time, identifying bottlenecks and queue delays across the end-to-end delivery pipeline.
How do you calculate Flow Efficiency in software delivery?
Flow Efficiency is calculated by dividing active Processing Time (PT) by the total Lead Time (LT), and multiplying by 100. The mathematical formula is: Flow Efficiency = (PT / LT) * 100. In most traditional enterprise teams, flow efficiency averages a mere 10% to 15% due to long wait states.
What is the difference between Lead Time and Cycle Time?
Lead Time measures the total elapsed time from the creation of a request or specification lock to its delivery in production. Cycle Time measures the time from when work actively begins on a ticket to when it is completed. Value Stream Mapping focuses heavily on Lead Time to expose queue delays.
Why does AI code generation require Value Stream Mapping?
While AI code assistants reduce active implementation time, they often increase downstream queue times (e.g. wait times for code review, security audits, and QA). VSM exposes these handoff delays, showing that optimization must target wait states rather than coding speed.
What are the common types of waste in software value streams?
Waste in software value streams includes wait times (tickets waiting in queue), handoffs (moving knowledge between roles), context switching (multitasking), overproduction (building unneeded features), and defects (rework due to bugs or misunderstandings).
About the Author
Vatsal Shah is a technology executive, system architect, and digital transformation consultant specializing in enterprise AI adoption, modern DevOps architectures, and high-performance engineering organizations. Over the past decade, he has engineered delivery pipelines and led strategic transformations for Fortune 500 enterprises and hyper-growth technology scale-ups, helping teams eliminate operational friction and accelerate software delivery.
Conclusion
If you want to accelerate your engineering organization, stop asking your developers to type faster. Stop measuring how many commits they make or how many lines of code they push. Take a step back, bring your team together, and draw your value stream. Locate the queues. Expose the wait states. Once you eliminate the invisible barriers that keep your code sitting in silence, you will discover that fast delivery is not a product of frantic effort, but a natural result of uninterrupted flow.
